zendit Product Demo
Each widget has a set of options for drilling down into data and when you have selected the time period you wish to view and other options that a widget may support, these settings are saved and the widget will be set to the last set options selected the next time you log in to the console.
Transaction & Product Widgets
System Performance Widgets

Transaction & Product Widgets are geared towards drilling into costs, product mix, sales (revenue), transaction volumes, top performing products, top destination countries and the distribution of sales across geographic regions.
Data selected for these widgets will be based on successfully delivered transactions and will not include transactions that failed.
Widgets with charts allow the user to mouse over plot points, pie slices, radial bars or countries (depending on the visualization of the data) to see the full detailed values of the item.
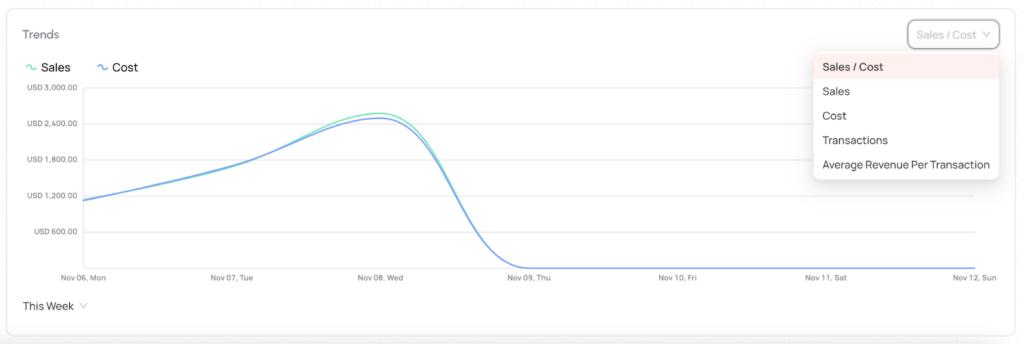
The trends line chart allows the user to view the trend of 5 metrics plotted on a line graph.
Metrics include Sales / Cost which shows revenue vs. cost of items on 2 lines, Sales as single line, Cost as a single line, Transaction volume as a single line or the Average Revenue Per Transaction as a single line.
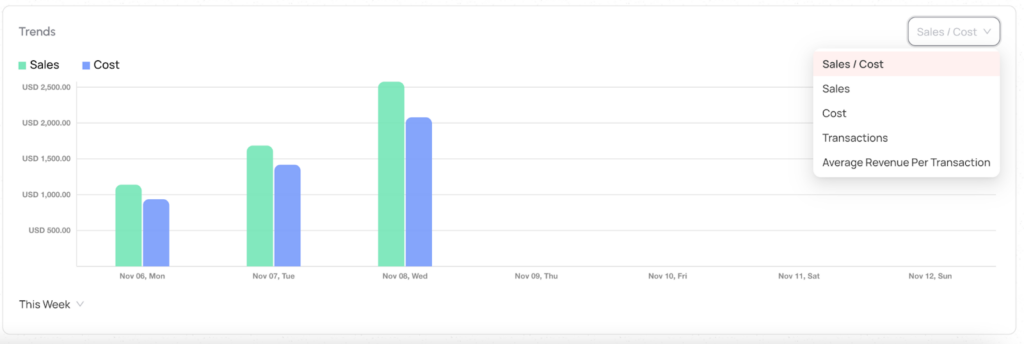
The trends bar chart supports the same options as the trends line chart but plots the data as bars. Metrics include Sales / Cost which shows revenue vs. cost of items on 2 bars, Sales as single bar, Cost as a single bar, Transaction volume as a single bar or the Average Revenue Per Transaction as a single bar.

The Top 5 pie chart allows you to view the top 5 (for selections that contain less than 5 items, zendit will select as many items that fit the options up to 5) products broken down by brand, country, or brand + country. You may view this data by transaction volume, sales, profit, cost or margin.

Chart can be broken down by brand, country, or brand + country
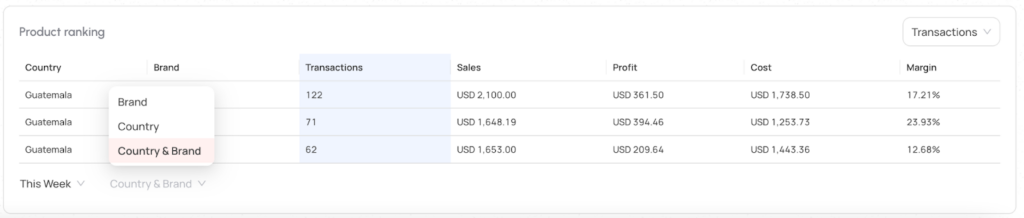
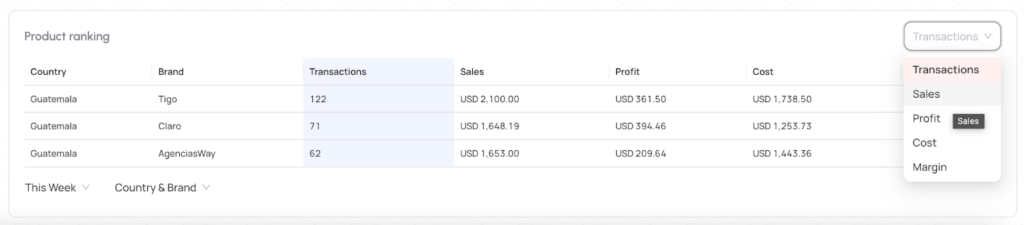
Product Ranking is table of data showing the top 5 (for selections that contain less than 5 items, Zendit will select as many items that fit the options up to 5) brands, countries or brand + country with the details (for selections that contain less than 5 items, Zendit will select as many items that fit the options up to 5.) Items can be ranked by transaction volume, sales, profits, costs or margins.

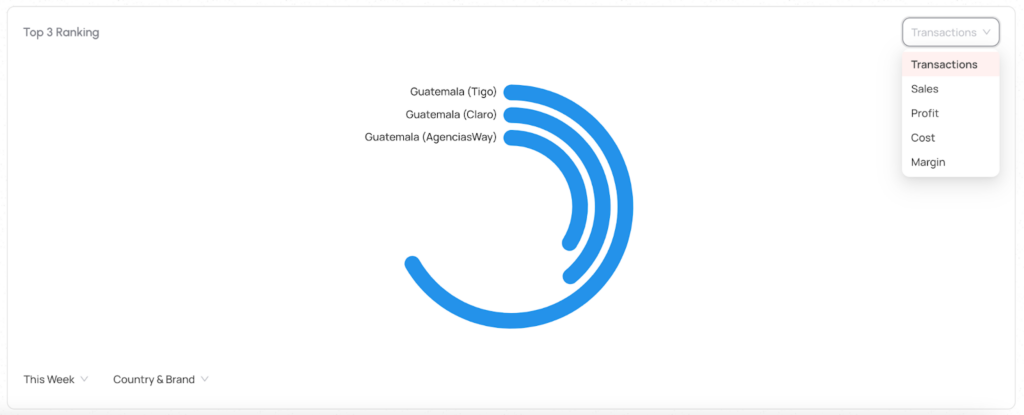
The Top 3 radial chart is similar to the top 5 pie chart but visualizes the data of the top 3 brands, countries or country + brand relative to each other. If less than 3 items are available in the selection the visualization will plot as many items as are available up to 3. Metrics options include transaction volume, sales, profits, costs or margins.

The chart may also be zoomed by selecting a region to view a specific region. In the zoomed view, the user may click and hold on the map to drag the view.

The WorldWide Ranking chart gives a view of the world where value is being transferred. The chart includes options to view distribution of all products or broken down by types of products including Mobile Top Up, Mobile Data, Mobile Bundles, Digital Gift Cards or Prepaid Utilities.
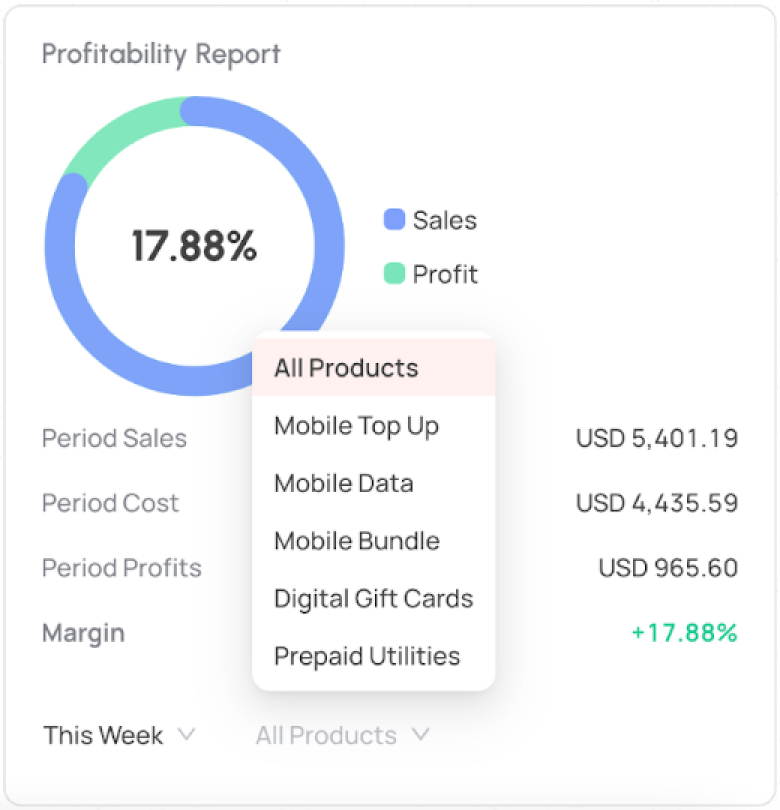
The Profitability Report shows Sales (Revenue) vs. Costs and shows the average margin based on product sales.
The report can be viewed for all product types or broken down into specific product types including Mobile Top Up, Mobile Data, Mobile Bundles, Digital Gift Cards and Prepaid Utilities.
System Performance Widgets allow the user to get a view into how their integration is performing with zendit.
Each widget observes a primary metric and can be clicked to show deeper information about the metric such as counts of specific reasons for transaction failures.
Most of these widgets also include a button to jump to the transaction report and review the transaction report to get a detailed view of the transactions during the time period selected for the widget.Transaction Success Rate
The Transaction Success Rate widget shows the percentage of transactions that were processed successfully with the count of success vs. the total number of transactions during the selected period.
When expanding the Transaction Success Rate Widget, reasons for transaction failures will be shown as a percentage with the details of the percentage of transactions that failed due to a Carrier Error, a Data Validation Error or a Low Balance in your wallet.
The Average Transaction Speed widget shows the average speed for a transaction from the time Zendit received the transaction to the time it finished processing with either a success or failed result.

For integrations with queue and retry disabled, the average transaction speeds will be lower but failure rates on the Transaction Success Rate widget may be higher when a recoverable error on processing the transaction.
If your integration has Queue & Retry enabled, this metric will include items that were queued for retry into the average speed. Items that fall into queue and retry and complete later will push this average speed up.
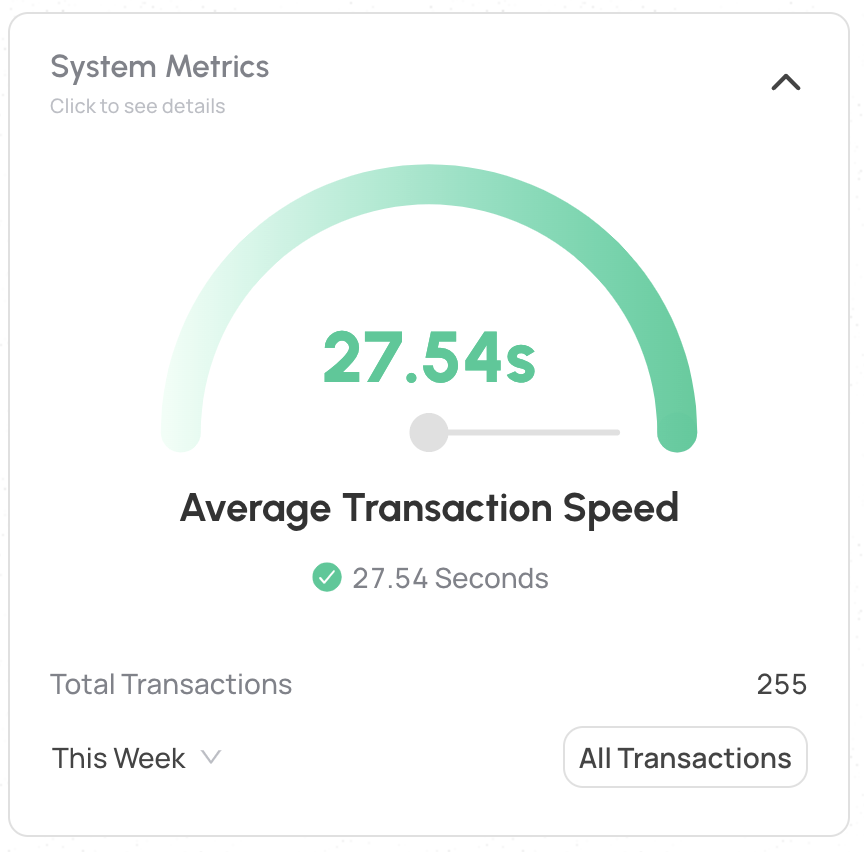
In the expanded view, the Average Transaction Speed widget includes the total number of transactions in the time period selected.
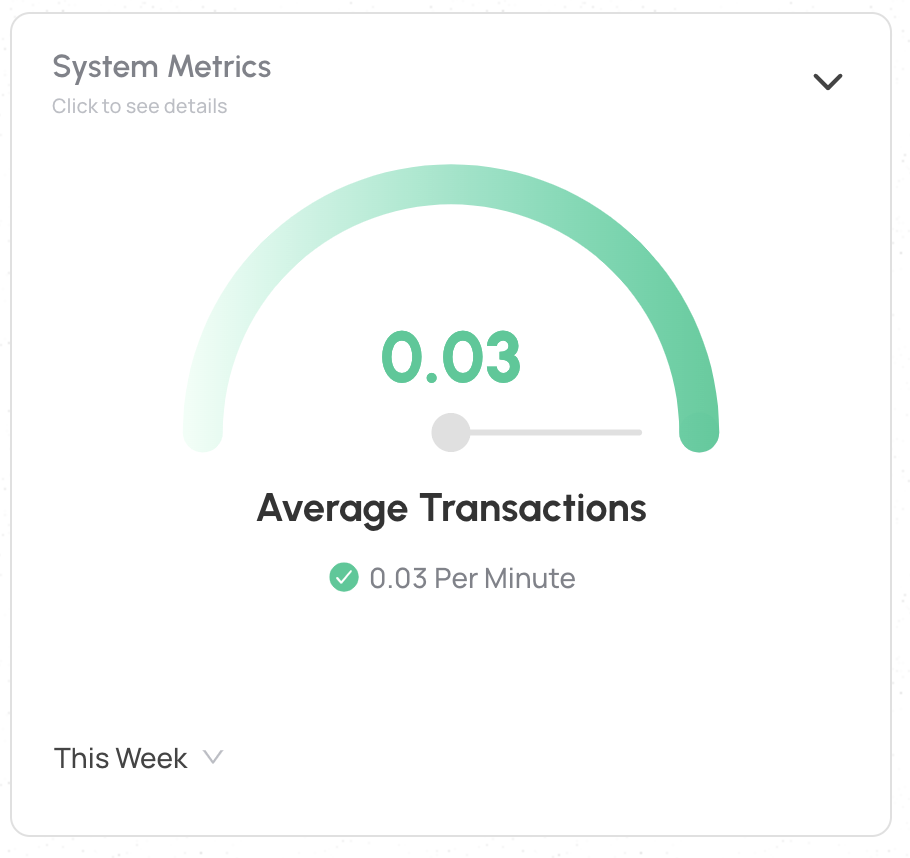
The Average Transactions widget will show the average number of transactions processed per minute during the selected time period.
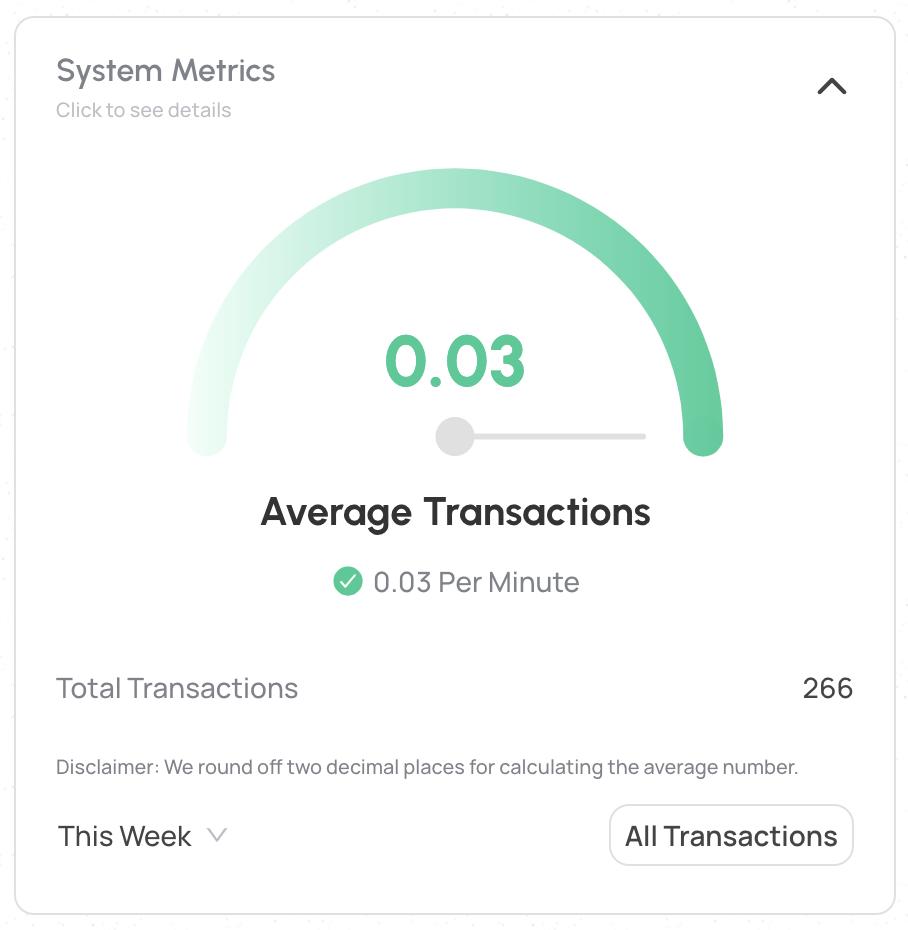
In the expanded Average Transactions widget, the number of transactions completed during the selected period will be displayed.
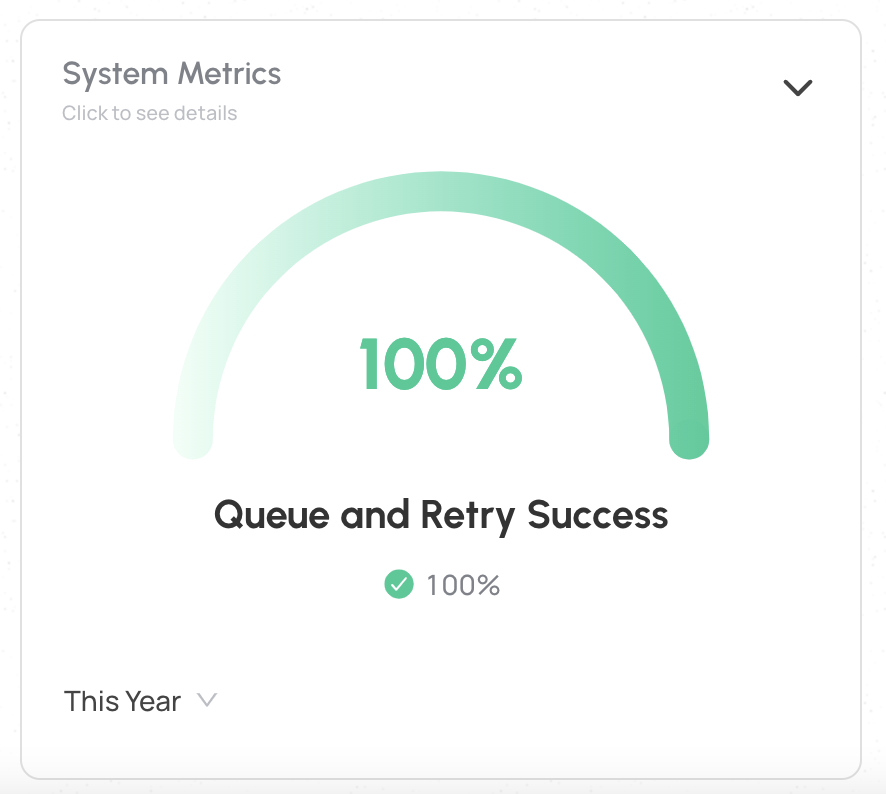
For customers that have enabled Queue & Retry, the success rate for transactions that fell into Queue & Retry will be displayed.
Transactions that have queued for 24 hours and then were failed will affect this value.
Retried transactions that failed within the 24 hour period and were not recoverable will also be included in this metric.
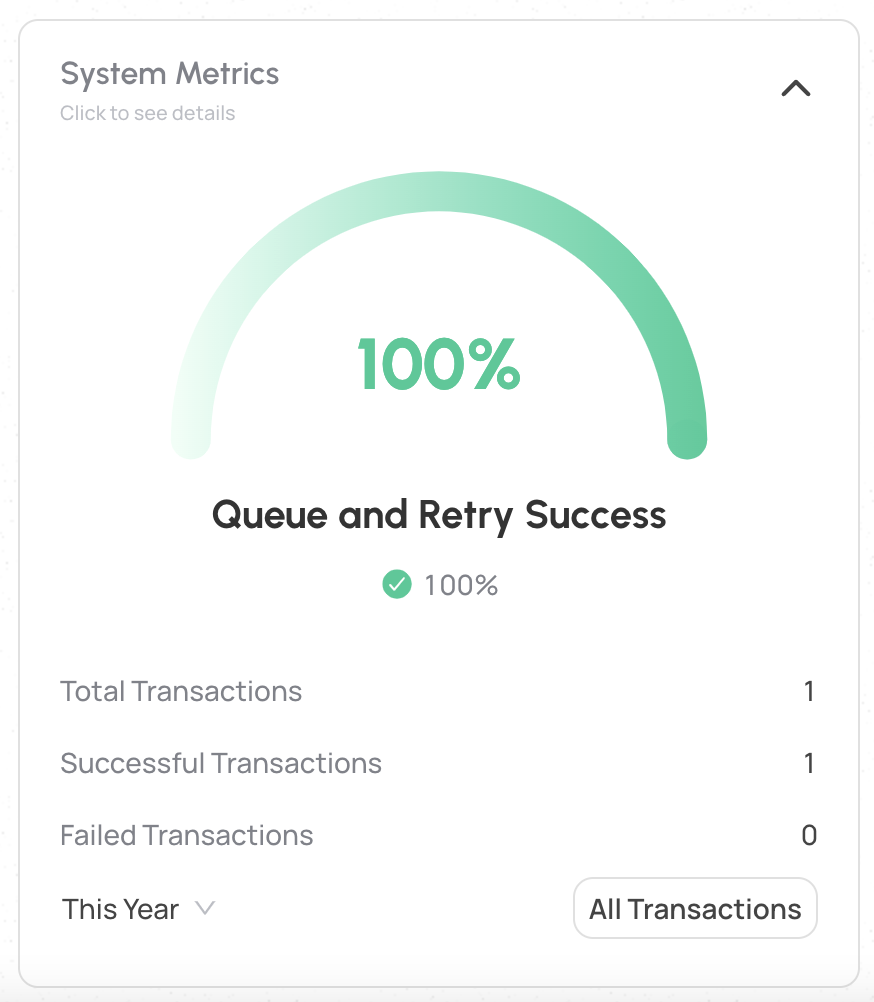
In the expanded view of the Queue & Retry Success widget, the total number of transactions that fell into Queue & Retry will be reported with the number that were ultimately successful and the number that were ultimately failed during Queue & Retry.
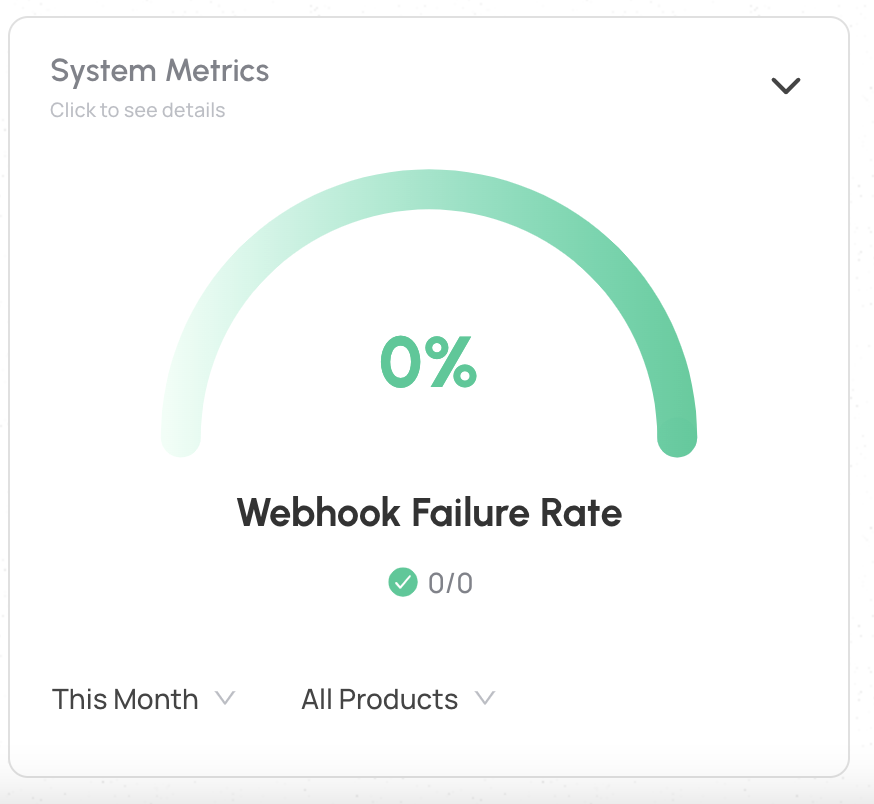
The Webhook Failure rate reports the number of webhooks sent to the client by zendit and the number where the webhook was unsuccessful.
This metric is available for clients who opt to receive transaction status via zendit’s webhooks.

This metric can also be drilled into per webhook type to get individual metrics for each webhook.
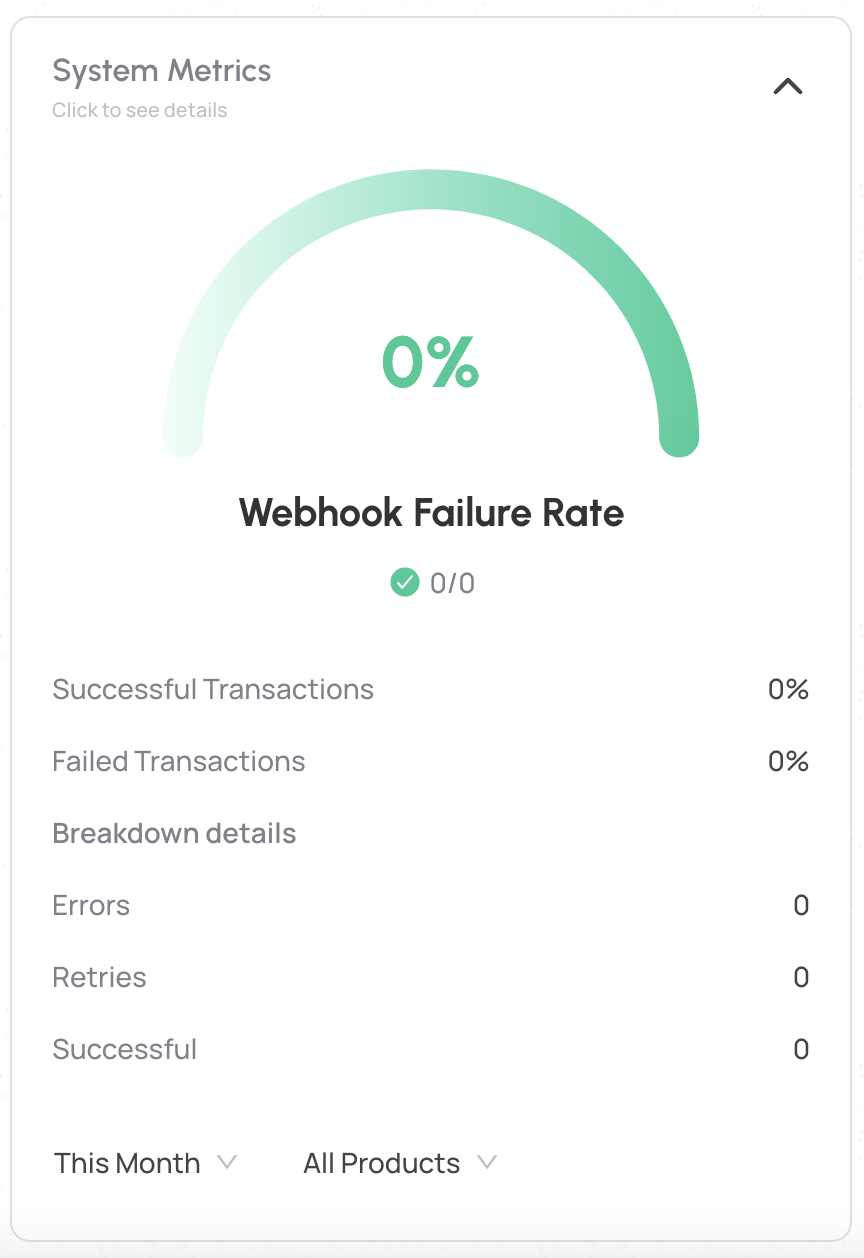
In the expanded view of the Webhook Failure Rate metric, the percentage of failed transactions unable to reach the client’s webhook server are reported as a percentage.
In this percentage, the definition of “failed transactions” includes both successfully completed and failed transactions and the failures are reported on reaching the webhook server.
The counts for errors in reaching the webhook server, the number of retries that were attempted and the number of successes reaching the webhook server.
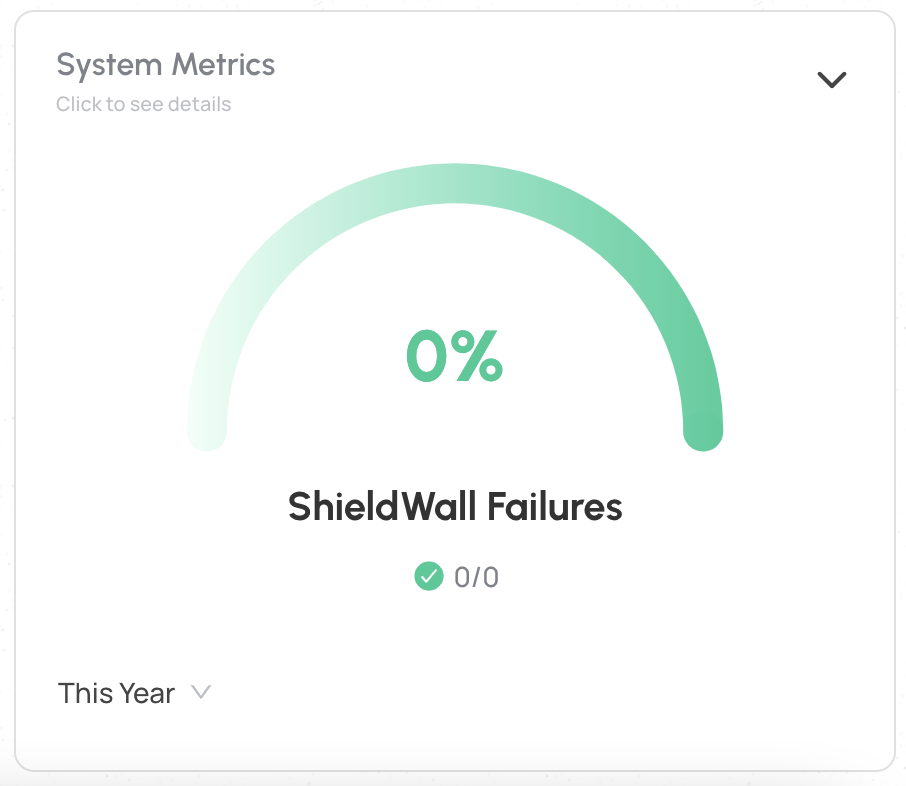
For clients who opt to implement the ShieldWall webhook, transactions that were failed as unrecognized will be reported by this metric with the total number of transactions that were blocked and the total number of transactions sent to ShieldWall.

In the expanded view for ShieldWall Failures, the total number transactions sent to ShieldWall are reported with the number of transactions that were passed as verified by the client’s Webhook server and the number that were blocked and failed as an unrecognized transaction.
Read more

Setting up your dashboard with how you want to view your data is easy with zendit learn how to customize it.

zendit supplies a sales report that provides summary level details and a transaction listing for the date period provided.

The zendit catalog consists of several sections that offer a variety of products for different purposes.

Get alerts to stay informed about upcoming promotions, catalog updates, security updates to a client environment, system outages and webhook failures.

Wallets in zendit serve as storage for funds used to purchase offers

Invite and manage users to your account
We’re here to help, please either use our contact us form or send us an email.
Contact Us Send us an email