zendit Product Demo
Setting up your dashboard with how you want to view your data is easy with zendit.

zendit’s dashboard allows you to add a custom set of charts and data to have quick access to key metrics for cost and transaction volumes, with numerous options to break down the data.
To setup your dashboard, simply click the “Modify Dashboard” button in the upper right hand corner. This will drop you into the editor for your dashboard.
Your dashboard may contain up to 12 widgets to drill down into the metrics that matter. For widgets that have options on drilling down into data, you may add the same widget type multiple times to your dashboard. As an example, if you are selling products for both Central America and Africa, you may add 2 geographic chart metrics with one zoomed to Central America and one zoomed to Africa.
Additionally, for users who use the zendit pricing system for their catalog, additional measures for revenue, profits and margins are available.

After clicking the Modify Dashboard button, you are dropped into the edit mode for your dashboard. The dashboard is a grid of columns and rows where you can place widgets right where you want them.
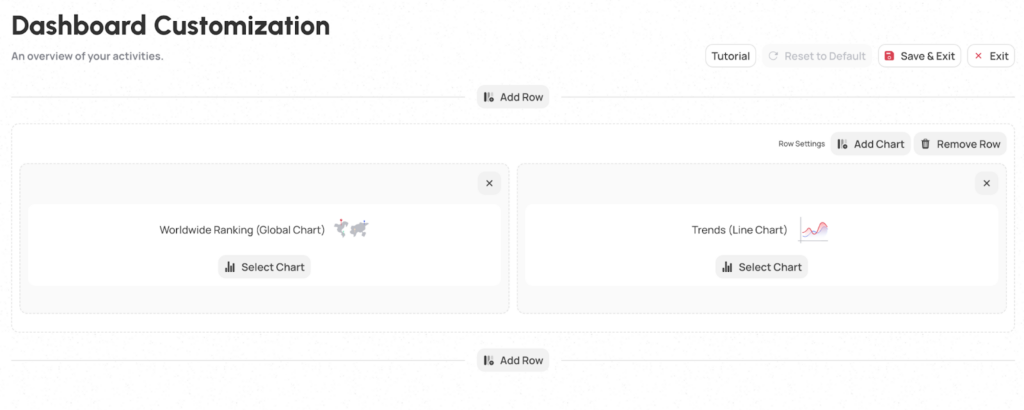
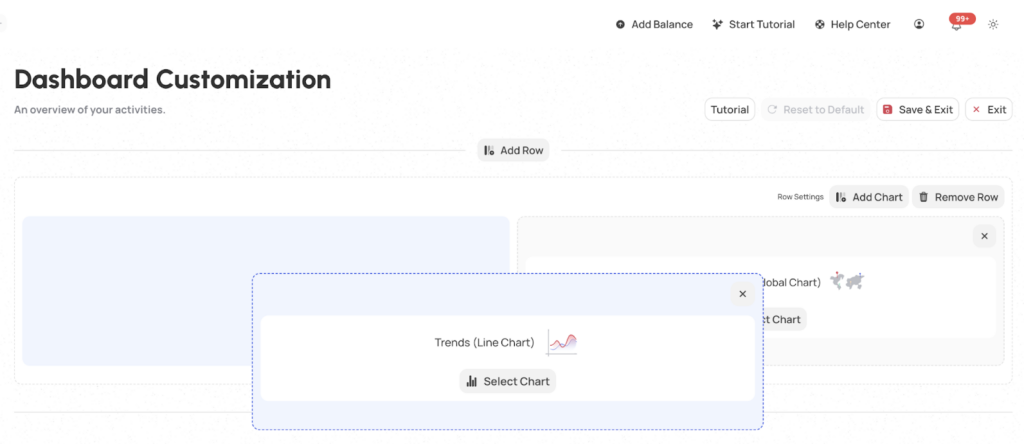
Each row may contain up to 3 widgets, to add an widget to an existing row, you can just click the “Add Chart” button on the row and it will give you a popup to select the widget you want to add to the row.

Once you’ve selected the type of widget you want, it will add the item to the row. You can additionally add rows above or below to get items ordered how you want.
You can remove a widget from the row by clicking on the “X” in the upper right corner of the widget.
You can also change what type of widget you want by clicking the “Select Chart” button on an existing widget to select a different type.
Dashboard customization also allows you to drag and drop widgets. You can drag them inside the same row to put them in a different order or drag a widget to a different row.
When you’re satisfied with the selections, click the “Save & Exit” button and your dashboard will display the widgets you have selected in the positions that you placed them.
zendit provides widgets with options to show Sales (Revenue), Margins and Profits and comparison of costs to sales.
Widgets with these types of metrics are only accurate for clients who integrate directly with the zendit catalog using the pricing system, or keep their pricing up to date in the Zendit catalog.
For clients who price their products externally from the zendit catalog, these measures will be approximated based on the suggested pricing in the Zendit catalog and are not guaranteed for accuracy.
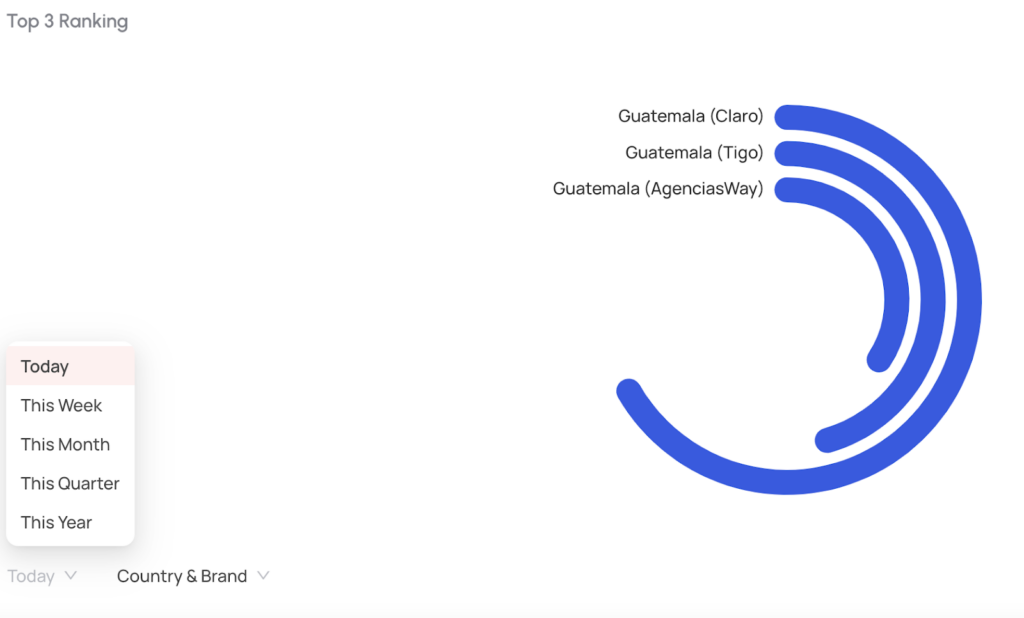
Each widget supports 5 date breakdowns:
For charts that plot data on the date time series (Trends Line and Bar Charts) the entire time period selected will be plotted and future dates that are part of the series (e.g. Selecting Time Period of this week and the current day is Wednesday) zendit will display values of 0 for the upcoming periods in the time selection.
For all time values series, the start of day is based on the timezone the user is located in. For users that travel, analytic values will be computed based on the timezone the user is currently in. For example a user in Los Angeles, all times will be handled using US Pacific Time Zone. For users in New York, all times will be handled using US Eastern Time Zone.
Read more

zendit supports 2 types of widgets: Transaction & Product Widgets and System Performance Widgets.

zendit supplies a sales report that provides summary level details and a transaction listing for the date period provided.

The zendit catalog consists of several sections that offer a variety of products for different purposes.

Get alerts to stay informed about upcoming promotions, catalog updates, security updates to a client environment, system outages and webhook failures.

Wallets in zendit serve as storage for funds used to purchase offers

Invite and manage users to your account
We’re here to help, please either use our contact us form or send us an email.
Contact Us Send us an email